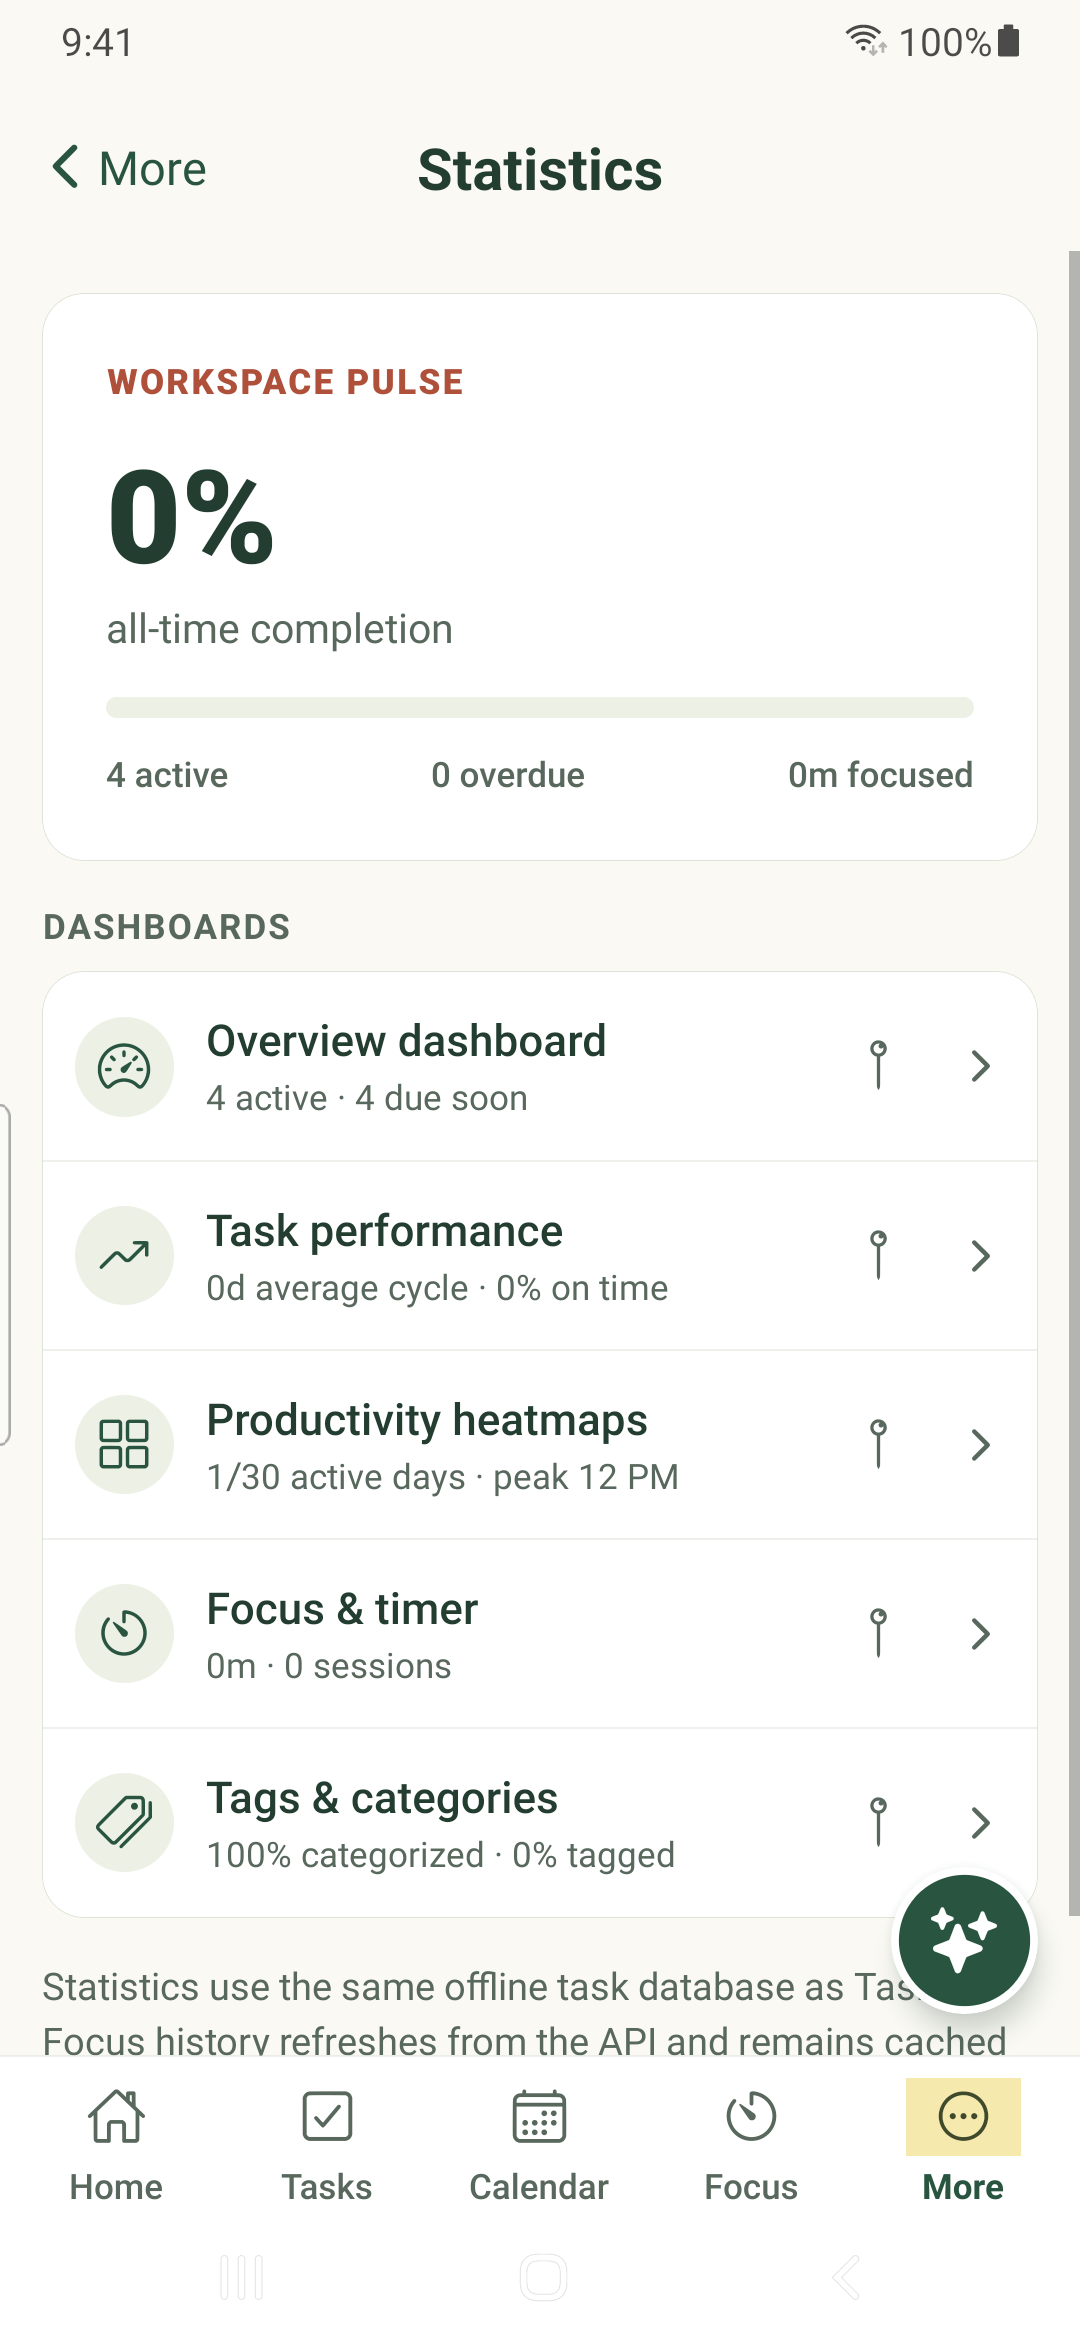

Explore task activity and timer history, then pin useful summaries to the bottom of Home.
Open a dashboard
- Open More → Statistics.
- Choose Overview dashboard, Task performance, Productivity heatmaps, Focus & timer, or Tags & categories.
- Scroll through its measures and tap task or organization rows that offer a drill-down.
- Use the back control to return to the dashboard list.
Pin a Home summary
- Find the dashboard in the Statistics list.
- Use its pin control to add or remove the Home summary.
- Return to Home and scroll down to see the pinned widget. Tap it for the full dashboard.
Read the measures in context
- Overview summarizes active work, completion and due-date pressure.
- Task performance looks at completion, cycle time, work age and checklist risks.
- Productivity heatmaps show task activity patterns, not continuous time tracking.
- Focus & timer uses recorded Pomodoro and Stopwatch history.
- Tags & categories summarizes organization and workload.
Offline and example data
Task measures use the locally available workspace. Focus history may be cached and is labeled when it is. Refresh after reconnecting before comparing devices.
Untouched starter examples are excluded from statistics. Screenshots in these guides use fictional tasks and are not claims about real customer productivity.
iPhone example
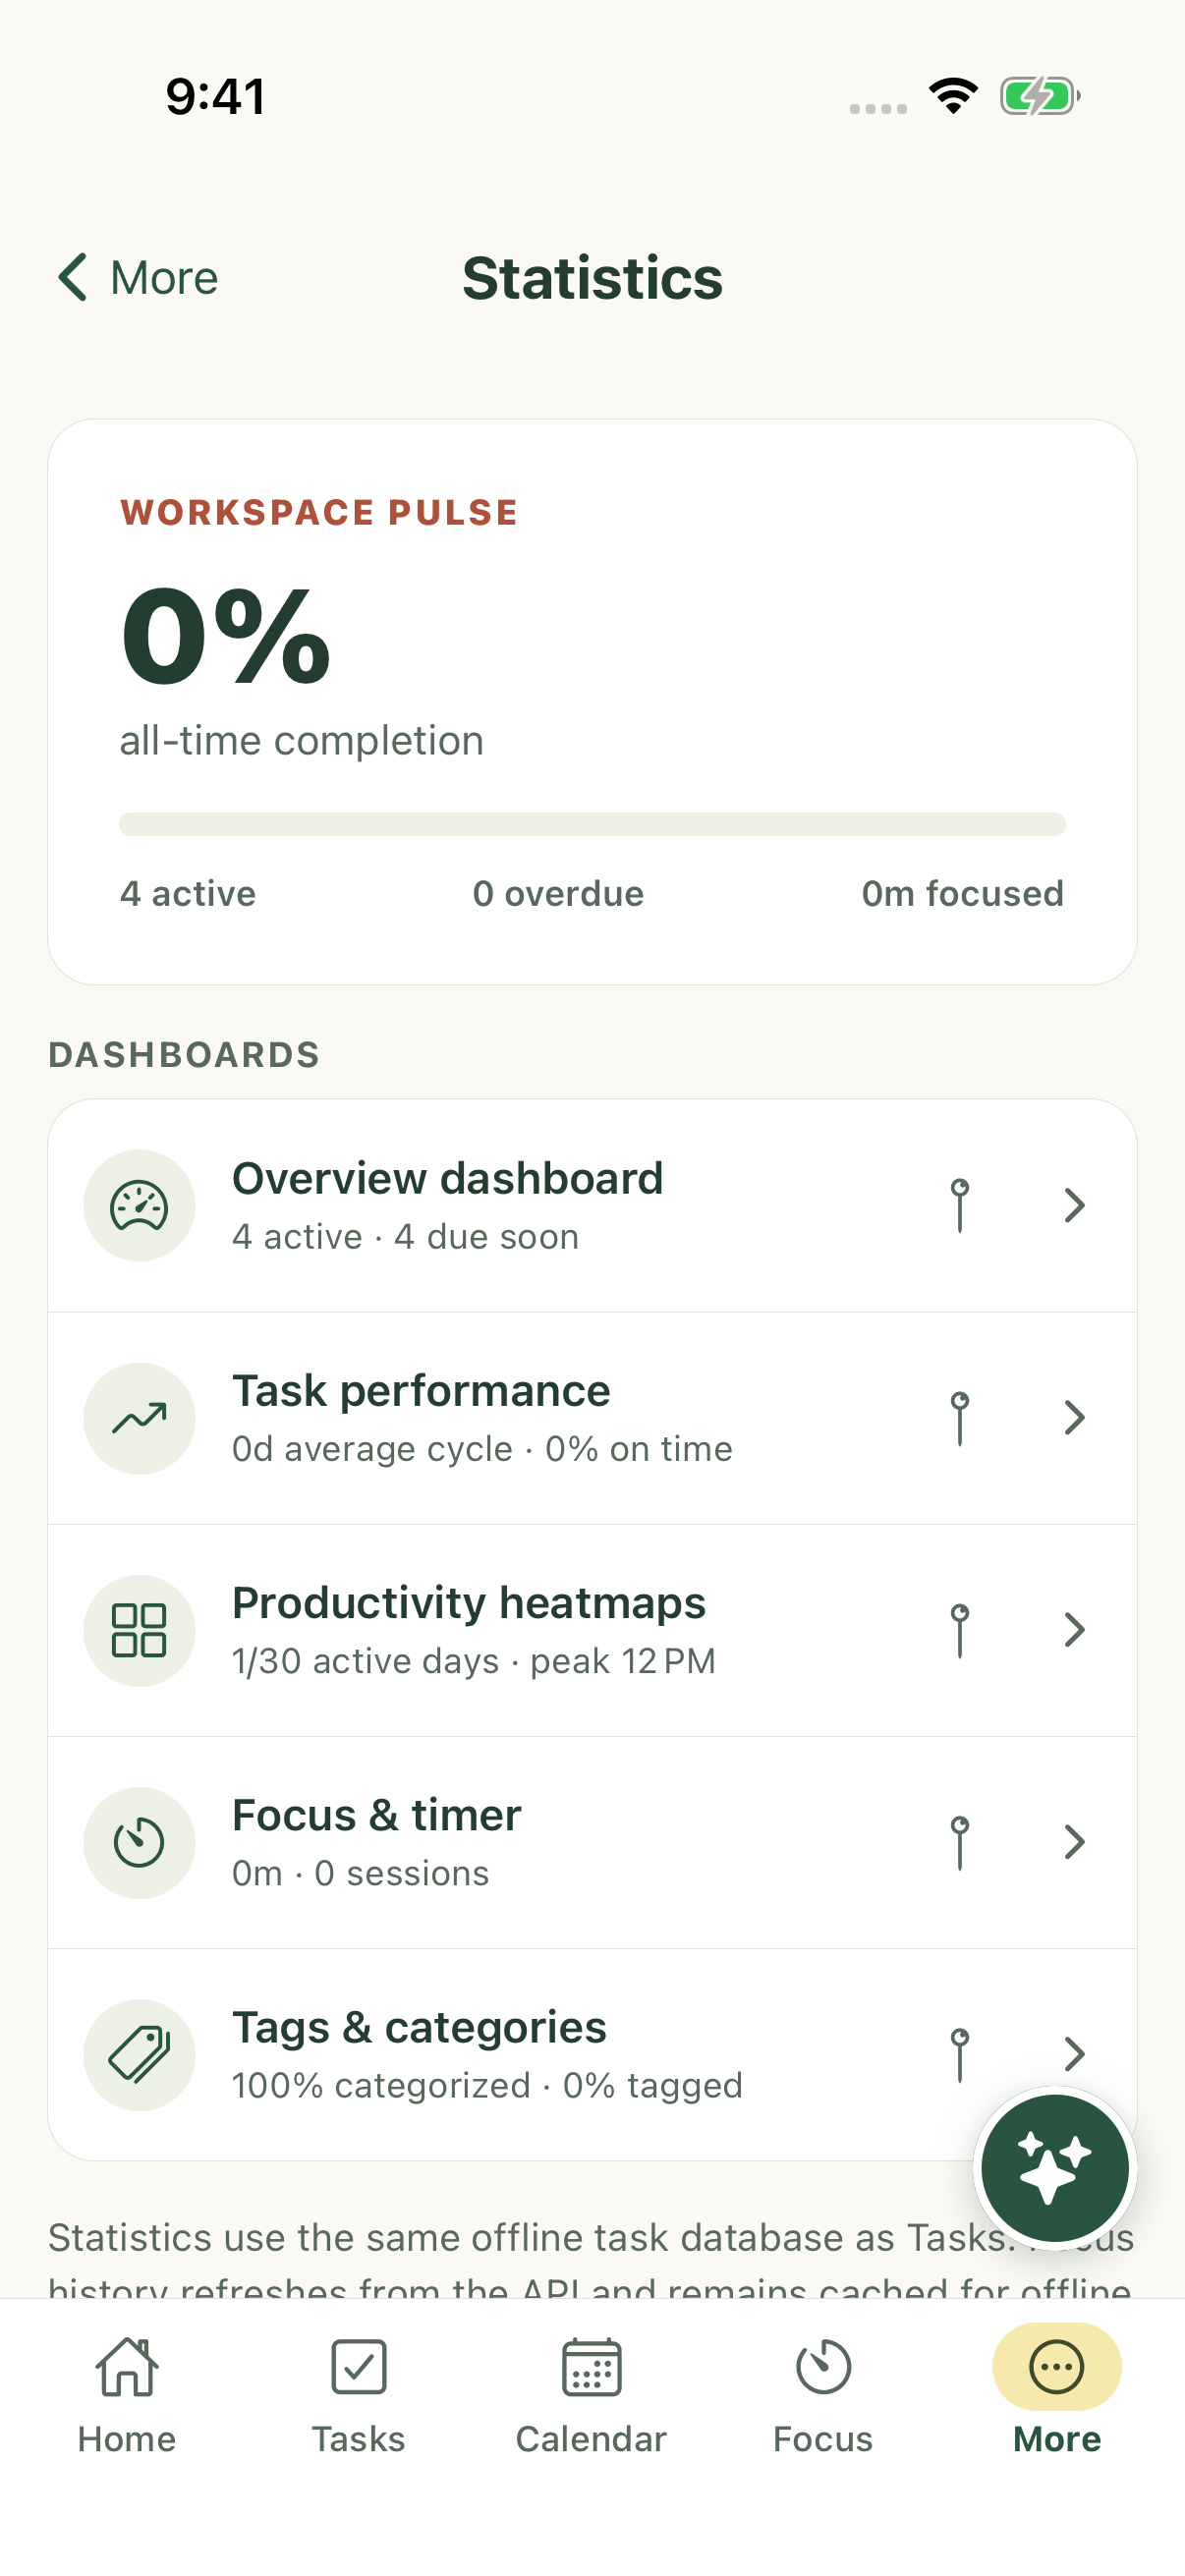
Android example