

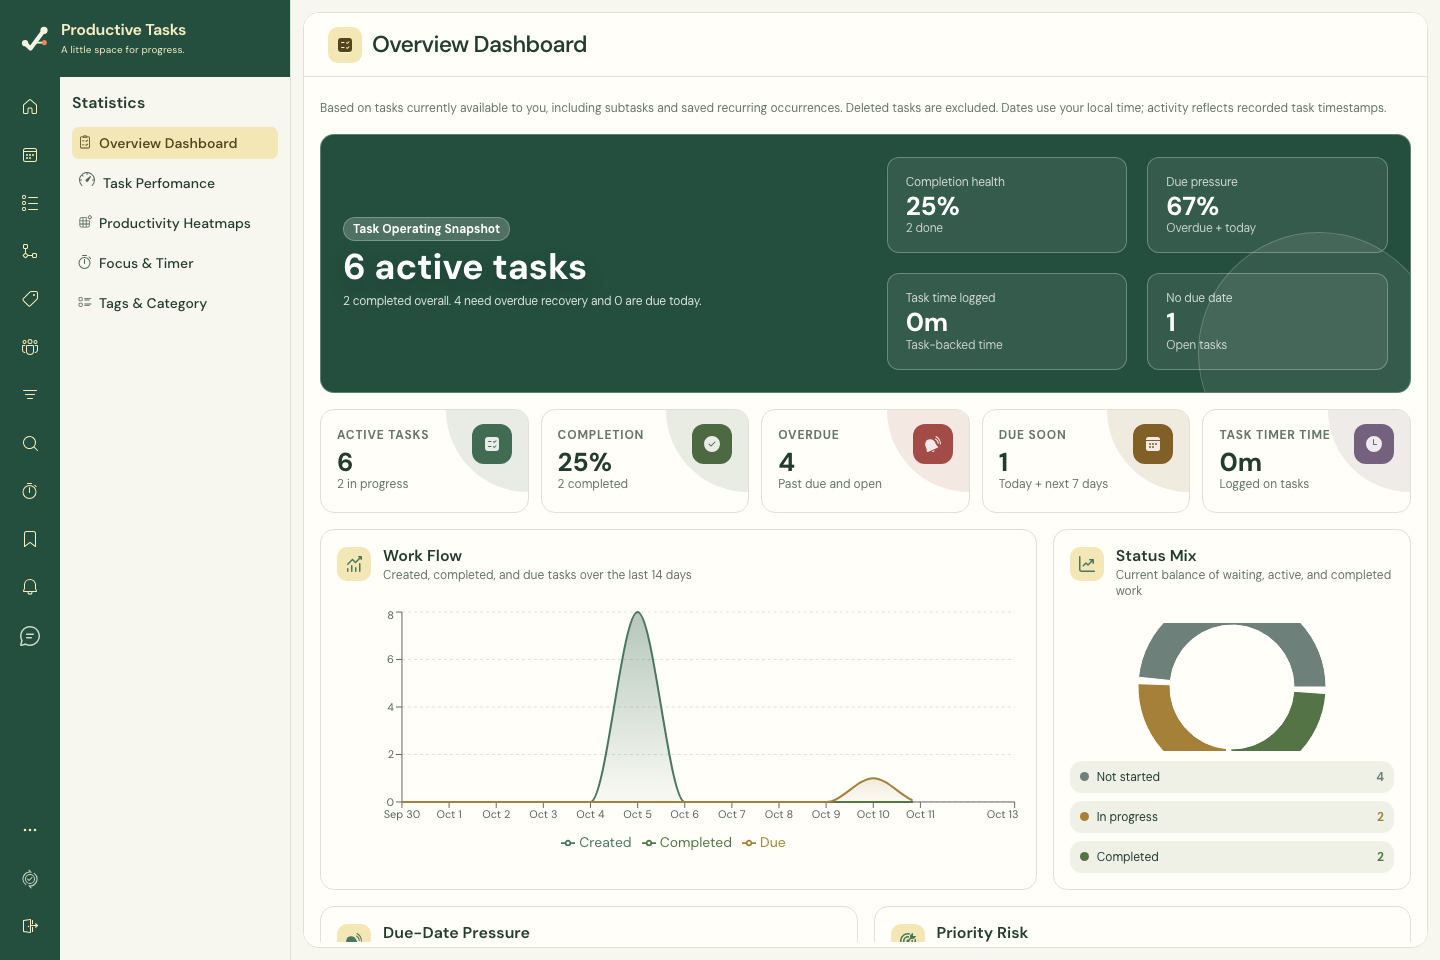
Choose a dashboard
| Dashboard | Use it to review |
|---|---|
| Overview | A broad summary of your task activity. |
| Task Performance | Completion and task-progress measures. |
| Productivity Heatmaps | Activity patterns across days and periods. |
| Focus & Timer | Recorded focus and stopwatch sessions. |
| Tags & Categories | How work is distributed across your organization. |
Read a chart in context
Read each chart’s period and metric labels before comparing values. Several web charts use a fixed period, such as the last 14 days or 365 days, rather than a selectable date range. A task count and recorded timer minutes measure different things.
Use the available chart details or drill-down controls to inspect the work behind a summary. Empty periods can be a correct reflection of your data.
Understand task measures
| Measure | How to interpret it |
|---|---|
| Active / open tasks | Tasks that are not currently completed. Overdue is a subset, not an extra collection of tasks. |
| Cycle time | Time from task creation to completion; this includes time waiting and is not measured working time. |
| Start lag | Time from creation to the task’s recorded start. |
| On-time rate | Whether completed tasks with due dates were completed by those dates. |
| Task touches | Creation, recorded start and completion activity. One task can contribute more than one touch. |
| Tag outcomes | A task with multiple tags can be counted under several tags. Do not add tag counts as if each task appeared once. |
Read timer history separately
Focus & Timer uses saved Focus and Stopwatch history, including unassigned time. Its heatmap groups minutes by the session’s start date; a running or unsaved session is not a completed history entry.
Category summaries use the task’s current category. A moved task can therefore appear under its new category. An unavailable task or unassigned session is labeled accordingly.
A warning that timer history could not be fully loaded means totals may be incomplete. Reconnect and reload before comparing those totals with earlier results.
On mobile
Open More → Statistics. Native dashboards use locally available tasks and cached timer history. You can pin a dashboard summary to mobile Home where the interface offers that action.
If the numbers look stale
Check that recent work and timer history have synchronized. Reopen or refresh when connected. Do not delete history or recreate sessions just to make a chart update.